概览
prometheus 是一套开源的系统监控报警框架。用户可以自定义 metrics 指标对服务进行监控。prometheus 可定义的 metrics 类型包括 Counter,Gauge, Histogram, Summary。prometheus 将各个 metric 按照 label 和 metric name 进行分别存储。具有同一 label 和 metric name 的记录按照时间序列的方式存储是在一起,即将值与产生的时间一同存储。
- Counter (计数器): Counter 是一个只增不减的计数器(除非发生系统重置),我们可以通过 Counter 记录应用程序内某事件的发生次数。
- Gauge(可增可减的仪表盘): Gauge 是一个 snapshot, 着重反映系统当前的状态。常见指标如:node_memory_MemFree(主机当前空闲的内容大小)、node_memory_MemAvailable(可用内存大小)都是Gauge类型的监控指标。
- Histogram && Summary(统计采样): Histogram 和 Summary 可以对指标进行统计采样。常见指标如: service_latency_seconds。
使用 prometheus - client
我们将继续沿用上一节的 sinatra 项目,并通过短短几行的改造使用 prometheus-client 监控我们的 sinatra 项目。使用 prometheus-client 之前,请先确保本机已安装 prometheus server。
1.打开我们的 Gemfile,声明我们将要使用的 prometheus-client。
source 'https://gems.ruby-china.com'

gem 'sinatra'
gem 'prometheus-client'
2.通过 bundle 安装 prometheus-client 依赖。
3.在 config.ru 文件中添加如下代码。其中 prometheus/middleware/collector 是用来收集所有的 HTTP 请求,而 prometheus/middleware/exporter 是用来向 prometheus 暴露 metrics。Rack::Deflater可使用 gzip 方式对 response 进行压缩.
require 'rack'
require 'sinatra'
require 'prometheus/middleware/collector'
require 'prometheus/middleware/exporter'

require_relative './app/application'

use Rack::Deflater
use Prometheus::Middleware::Collector
use Prometheus::Middleware::Exporter

run Application
application.rb
class Application < Sinatra::Base

  get '/' do
    "hello world"
  end

end
4.现在我们可以通过 bundle exec rackup -p 9292 在 9292 端口运行我们的服务了,通过浏览器访问 localhost:9292/metrics可以看到目前正在统计的 metrics;
# TYPE http_server_requests_total counter
# HELP http_server_requests_total The total number of HTTP requests handled by the Rack application.

# TYPE http_server_request_duration_seconds histogram
# HELP http_server_request_duration_seconds The HTTP response duration of the Rack application.

# TYPE http_server_exceptions_total counter
# HELP http_server_exceptions_total The total number of exceptions raised by the Rack application.
可以看到目前一共 3 个 metrics,分别对应 http_server_requests_total,http_server_request_duration_seconds 和 http_server_exceptions_total。我们每对服务进行一次请求,对应的 metrics 就会产生相应的记录。
http_server_request_duration_seconds_bucket{method="get",path="/metrics",le="0.005"} 312.0
http_server_request_duration_seconds_bucket{method="get",path="/metrics",le="0.01"} 312.0
http_server_request_duration_seconds_bucket{method="get",path="/metrics",le="0.025"} 312.0
http_server_request_duration_seconds_bucket{method="get",path="/metrics",le="0.05"} 312.0
http_server_request_duration_seconds_bucket{method="get",path="/metrics",le="0.1"} 312.0
http_server_request_duration_seconds_bucket{method="get",path="/metrics",le="0.25"} 312.0
http_server_request_duration_seconds_bucket{method="get",path="/metrics",le="0.5"} 312.0
http_server_request_duration_seconds_bucket{method="get",path="/metrics",le="1"} 312.0
http_server_request_duration_seconds_bucket{method="get",path="/metrics",le="2.5"} 312.0
http_server_request_duration_seconds_bucket{method="get",path="/metrics",le="5"} 312.0
http_server_request_duration_seconds_bucket{method="get",path="/metrics",le="10"} 312.0
http_server_request_duration_seconds_bucket{method="get",path="/metrics",le="+Inf"} 312.0
http_server_request_duration_seconds_sum{method="get",path="/metrics"} 0.3551080000179354
http_server_request_duration_seconds_count{method="get",path="/metrics"} 312.0
上面显示了 metrics 接口一共接收了 312 次的请求。请求响应时间 le(小于或等于) 0.005 秒的请求次数也是 312 次。http_server_request_duration_seconds_sum{method="get",path="/metrics"} 0.3551080000179354表示 312 次请求的总响应时间为 0.3551080000179354 秒。
5.我们的客户端暴露了相应的 metrics 后,还要配置我们 prometheus server 对相应的 metrics 进行采集。打开 prometheus 目录下的 prometheus.yml
spike:prometheus-2.17.1.darwin-amd64 apple1$ ls
LICENSE         consoles        prometheus.yml
NOTICE          data            promtool
console_libraries   prometheus      tsdb
# my global config
global:
  scrape_interval:     15s # Set the scrape interval to every 15 seconds. Default is every 1 minute.
  evaluation_interval: 15s # Evaluate rules every 15 seconds. The default is every 1 minute.
  # scrape_timeout is set to the global default (10s).

# Alertmanager configuration
alerting:
  alertmanagers:
  - static_configs:
    - targets:
      # - alertmanager:9093

# Load rules once and periodically evaluate them according to the global 'evaluation_interval'.
rule_files:
  # - "first_rules.yml"
  # - "second_rules.yml"

# A scrape configuration containing exactly one endpoint to scrape:
# Here it's Prometheus itself.
scrape_configs:
  # The job name is added as a label `job=<job_name>` to any timeseries scraped from this config.
  - job_name: 'prometheus'

    # metrics_path defaults to '/metrics'
    # scheme defaults to 'http'.

    static_configs:
    - targets: ['localhost:9292'] //要采集的服务器地址
prometheus 默认 15s 进行一次采集。在配置好需要采集的服务地址后,通过./prometheus运行 prometheus 服务器。此时你就可以在 sinatra 的 server output 看到 metrics path 的请求记录。
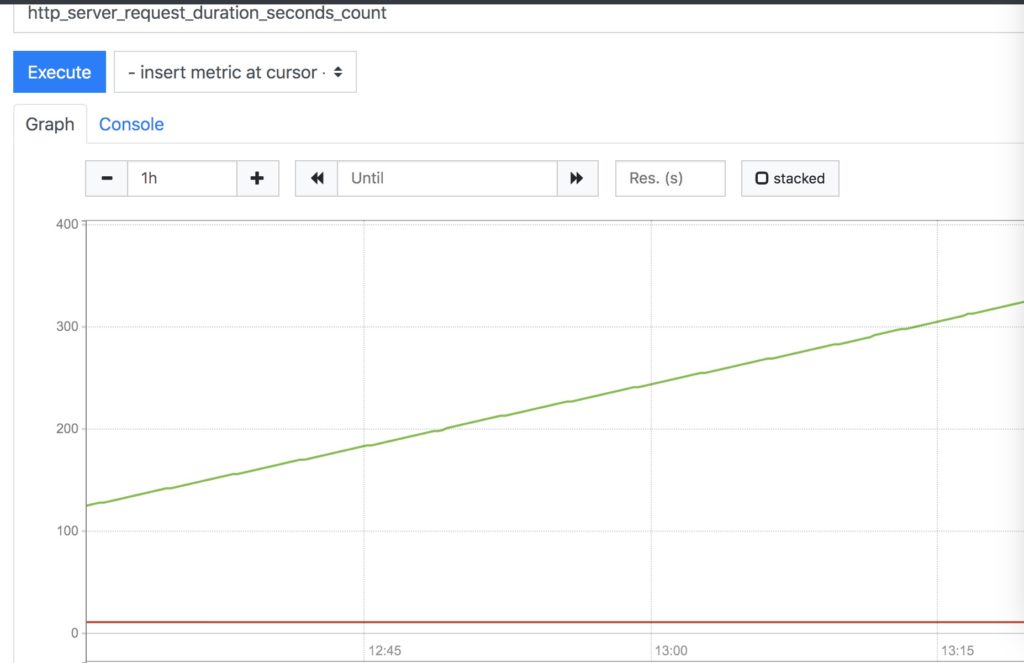
运行浏览器访问 localhost:9090 ,选择相应的 metrics 可以看到基于时间的相关数据。
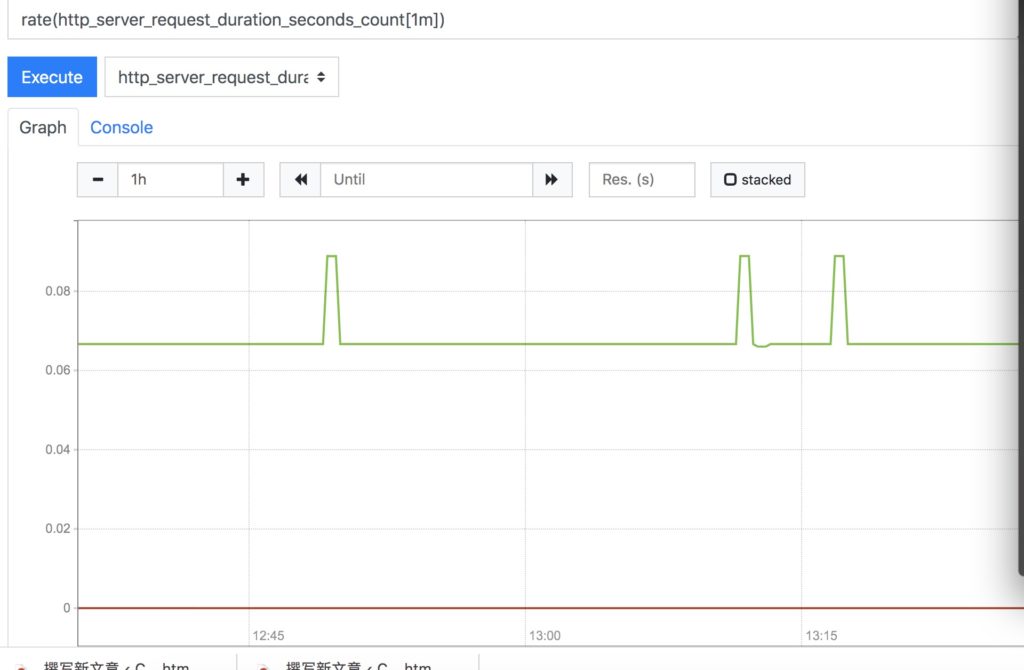
prometheus 提供了一套 promql 语言,你可以通过相应的语法对数据进行分析和聚合。下图就展示了在过去1分钟每个接口每秒的平均请求次数。
总结
这节我们了解了如何在 ruby 应用中使用 prometheus-client。并且通过两个 rack middlewares 监控了系统内的 http 请求状况。下一节,我们将展示如何在业务中使用 prometheus,获取监控数据。