概览
上节我们已经介绍过如何通过 prometheus - client 自带的 exporter 监控服务接口相关的数据。这节我们将带领大家在业务开发中运用 prometheus,实现对业务的监控。
基于 prometheus , alertmanager 和 grafana 对业务情况进行监控,可实现业务状态可视化,基于定制的业务规则进行报警等功能。但是该方案会对系统具有一定的侵入型,用户需要在原有的业务逻辑中插入相关的统计代码。
使用 prometheus - client
设想一下这样的场景。我们正在开发一个商城系统,pm 现在告知我们现在需要对用户订单支付的状态进行统计与数据可视化,在用户的支付过程中,商城依赖的支付中心可能会出现服务错误等情况,对于这种情况又需要及时报警。现在,我们将基于 prometheus 开发上述的需求。
首先,我们创建 lib 目录,在该目录下我们新建 prometheus.rb 文件。我们将在 prometheus.rb 文件中注册一个 counter,该 counter 用于统计订单支付状态。
lib/prometheus.rb
prometheus = Prometheus::Client.registry
$counter = Prometheus::Client::Counter.new(:total_payment_counts, docstring: 'count payment status', labels: [:status])
prometheus.register($counter)
在初始化 counter 时,我们声明了名称为 status 的 labels。在 prometheus 中,我们可以通过 label 来区分同一个 metric 的不同类别数据,并且相同 metric 下不同的 label 数据将会被分别存储。
我们的支付相关逻辑保留在 app/application.rb 文件中,在此,我们将用 rand 函数随机模拟订单支付成功,失败以及取消的情况。
app/application.rb
require 'sinatra'

class Application < Sinatra::Base
  PAYMENT_STATUS = %i(success cancel failed)

  get '/order/payment' do
    # Note: 用随机函数模拟支付结果
    position = rand(0..PAYMENT_STATUS.length - 1)
    result = PAYMENT_STATUS.at(position)

    # Note: prometheus
    $counter.increment(by: 1, labels: { status:  result })

    "the order status: #{result}\n"
  end

end
现在,在终端启动我们的服务,并且访问localhost:9292/order/payment 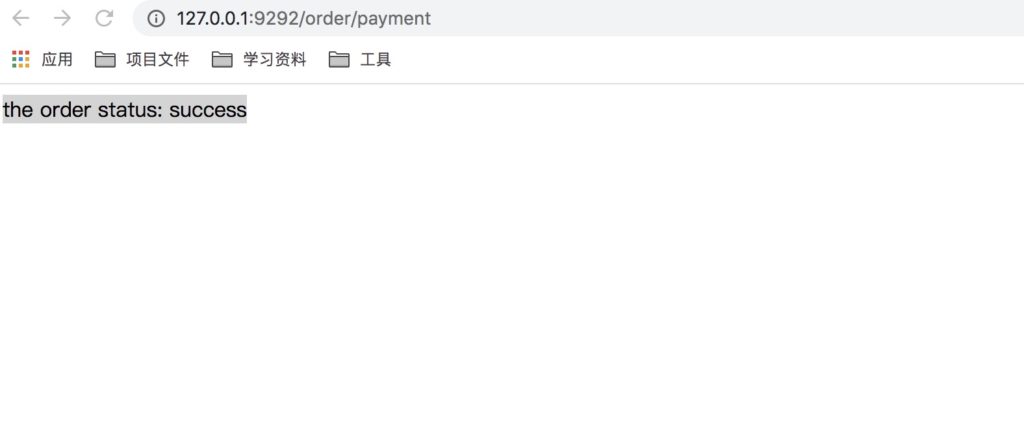
可以看到,我们现在已经成功支付一笔订单了。为了产生更多的数据方便统计与展示,我们可以用 curl command 多次请求我们的接口,并且为了验证 prometheus 正确地统计了订单数据,我们将返回结果先保存在 txt 文件中,并且将结果按照状态进行统计,将其与 prometheus 统计的数据进行对比。
spike:~ apple1$ for n in {1..500}; do curl -X GET 127.0.0.1:9292/order/payment; done >> results.txt
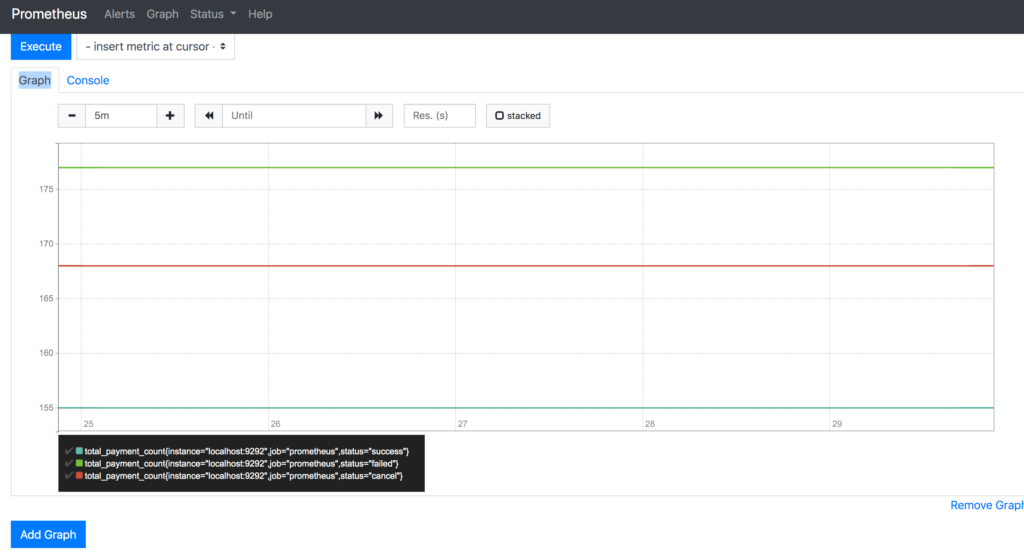
spike:~ apple1$ cat results.txt |grep -c success
155
spike:~ apple1$ cat results.txt |grep -c failed
177
spike:~ apple1$ cat results.txt |grep -c cancel
168
由此我们可以看出,共有 155 次支付成功,177次支付失败和 168 次取消支付。与 prometheus 后台的数据进行对比后发现一致。
总结
对业务系统进行监控的方案实在很多。目前普遍都是通过日志系统进行业务记录,由 logstash 收集日志并推送至 Elasticsearch,Elasticsearch 则提供日志的搜索与存储功能,并且再通过 Kibana 提供可视化。在框架选择时,你可以根据业务情况对比以下方面进行考量。
Use Hosted Prometheus when you …

- need a time-series database monitoring solution.
- need long-term storage for Prometheus metrics.
- need to use tags/labels for metrics.
- need to run alerts across different data sources.
- want to use and query both Prometheus and Graphite though - Grafana all as a part of the same service.

Use ELK when you …

- need great searching.
- need forecasting for data.
- are already using one part of the ELK stack, making it easy to expand to using the others.